// Tutorial //
How To Build A SIEM with Suricata and Elastic Stack on Ubuntu 20.04

Not using Ubuntu 20.04?Choose a different version or distribution.
Introduction
The previous tutorials in this series guided you through installing, configuring, and running Suricata as an Intrusion Detection (IDS) and Intrusion Prevention (IPS) system. You also learned about Suricata rules and how to create your own.
In this tutorial you will explore how to integrate Suricata with Elasticsearch, Kibana, and Filebeat to begin creating your own Security Information and Event Management (SIEM) tool using the Elastic stack and Ubuntu 20.04. SIEM tools are used to collect, aggregate, store, and analyze event data to search for security threats and suspicious activity on your networks and servers.
The components that you will use to build your own SIEM tool are:
- Elasticsearch to store, index, correlate, and search the security events that come from your Suricata server.
- Kibana to display and navigate around the security event logs that are stored in Elasticsearch.
- Filebeat to parse Suricata’s
eve.jsonlog file and send each event to Elasticsearch for processing. - Suricata to scan your network traffic for suspicious events, and either log or drop invalid packets.
First you’ll install and configure Elasticsearch and Kibana with some specific authentication settings. Then you’ll add Filebeat to your Suricata system to send its eve.json logs to Elasticsearch.
Finally, you’ll learn how to connect to Kibana using SSH and your web browser, and then load and interact with Kibana dashboards that show Suricata’s events and alerts.
Prerequisites
If you have been following this tutorial series then you should already have Suricata running on an Ubuntu 20.04 server. This server will be referred to as your Suricata server.
- If you still need to install Suricata then you can follow this tutorial that explains How To Install Suricata on Ubuntu 20.04.
- You will also need some Suricata signatures loaded and configured to generate alerts, or to drop traffic. Follow the Understanding Suricata Signatures tutorial in this series for a guide on how to create your own signatures. Or you can download a comprehensive set of signatures by following Step 3 — Updating Suricata Rulesets in the How To Install Suricata tutorial.
You will also need a second server to host Elasticsearch and Kibana. This server will be referred to as your Elasticsearch server. It should be an Ubuntu 20.04 server with:
- 4GB RAM and 2 CPUs set up with a non-root sudo user. You can achieve this by following the Initial Server Setup with Ubuntu 20.04.
For the purposes of this tutorial, both servers should be able to communicate using private IP addresses. You can use a VPN like WireGuard to connect your servers, or use a cloud-provider that has private networking between hosts. You can also choose to run Elasticsearch, Kibana, Filebeat, and Suricata on the same server for experimenting.
Step 1 — Installing Elasticsearch and Kibana
The first step in this tutorial is to install Elasticsearch and Kibana on your Elasticsearch server. To get started, add the Elastic GPG key to your server with the following command:
- curl -fsSL https://artifacts.elastic.co/GPG-KEY-elasticsearch | sudo apt-key add -
Next, add the Elastic source list to the sources.list.d directory, where apt will search for new sources:
- echo "deb https://artifacts.elastic.co/packages/7.x/apt stable main" | sudo tee -a /etc/apt/sources.list.d/elastic-7.x.list
Now update your server’s package index and install Elasticsearch and Kibana:
- sudo apt update
- sudo apt install elasticsearch kibana
Once you are done installing the packages, find and record your server’s private IP address using the ip address show command:
- ip -brief address show
You will receive output like the following:
Outputlo               UNKNOWN        127.0.0.1/8 ::1/128
eth0             UP             159.89.122.115/20 10.20.0.8/16 2604:a880:cad:d0::e56:8001/64 fe80::b832:69ff:fe46:7e5d/64
eth1             UP             10.137.0.5/16 fe80::b883:5bff:fe19:43f3/64
The private network interface in this output is the highlighted eth1 device, with the IPv4 address 10.137.0.5/16. Your device name, and IP addresses will be different. However, the address will be from the following reserved blocks of addresses:
10.0.0.0to10.255.255.255(10/8 prefix)172.16.0.0to172.31.255.255(172.16/12 prefix)192.168.0.0to192.168.255.255(192.168/16 prefix)
If you would like to learn more about how these blocks are allocated visit the RFC 1918 specification)
Record the private IP address for your Elasticsearch server (in this case 10.137.0.5). This address will be referred to as your_private_ip in the remainder of this tutorial. Also note the name of the network interface, in this case eth1. In the next part of this tutorial you will configure Elasticsearch and Kibana to listen for connections on the private IP address coming from your Suricata server.
Step 2 — Configuring Elasticsearch
Elasticsearch is configured to only accept local connections by default. Additionally, it does not have any authentication enabled, so tools like Filebeat will not be able to send logs to it. In this section of the tutorial you will configure the network settings for Elasticsearch and then enable Elasticsearch’s built-in xpack security module.
Configuring Elasticsearch Networking
Since Your Elasticsearch and Suricata servers are separate, you will need to configure Elasticsearch to listen for connections on its private network interface. You will also need to configure your firewall rules to allow access to Elasticsearch on your private network interface.
Open the /etc/elasticsearch/elasticsearch.yml file using nano or your preferred editor:
- sudo nano /etc/elasticsearch/elasticsearch.yml
Find the commented out #network.host: 192.168.0.1 line between lines 50–60 and add a new line after it that configures the network.bind_host setting, as highlighted below:
# By default Elasticsearch is only accessible on localhost. Set a different
# address here to expose this node on the network:
#
#network.host: 192.168.0.1
network.bind_host: ["127.0.0.1", "your_private_ip"]
#
# By default Elasticsearch listens for HTTP traffic on the first free port it
# finds starting at 9200. Set a specific HTTP port here:
Substitute your private IP in place of the your_private_ip address. This line will ensure that Elasticsearch is still available on its local address so that Kibana can reach it, as well as on the private IP address for your server.
Next, go to the end of the file using the nano shortcut CTRL+v until you reach the end.
Add the following highlighted lines to the end of the file:
. . .
discovery.type: single-node
xpack.security.enabled: true
The discovery.type setting allows Elasticsearch to run as a single node, as opposed to in a cluster of other Elasticsearch servers. The xpack.security.enabled setting turns on some of the security features that are included with Elasticsearch.
Save and close the file when you are done editing it. If you are using nano, you can do so with CTRL+X, then Y and ENTER to confirm.
Finally, add firewall rules to ensure your Elasticsearch server is reachable on its private network interface. If you followed the prerequisite tutorials and are using the Uncomplicated Firewall (ufw), run the following commands:
- sudo ufw allow in on eth1
- sudo ufw allow out on eth1
Substitute your private network interface in place of eth1 if it uses a different name.
Next you will start the Elasticsearch daemon and then configure passwords for use with the xpack security module.
Starting Elasticsearch
Now that you have configured networking and the xpack security settings for Elasticsearch, you need to start it for the changes to take effect.
Run the following systemctl command to start Elasticsearch:
- sudo systemctl start elasticsearch.service
Once Elasticsearch finishes starting, you can continue to the next section of this tutorial where you will generate passwords for the default users that are built-in to Elasticsearch.
Configuring Elasticsearch Passwords
Now that you have enabled the xpack.security.enabled setting, you need to generate passwords for the default Elasticsearch users. Elasticsearch includes a utility in the /usr/share/elasticsearch/bin directory that can automatically generate random passwords for these users.
Run the following command to cd to the directory and then generate random passwords for all the default users:
- cd /usr/share/elasticsearch/bin
- sudo ./elasticsearch-setup-passwords auto
You will receive output like the following. When prompted to continue, press y and then RETURN or ENTER:
Initiating the setup of passwords for reserved users elastic,apm_system,kibana,kibana_system,logstash_system,beats_system,remote_monitoring_user.
The passwords will be randomly generated and printed to the console.
Please confirm that you would like to continue [y/N]y


Changed password for user apm_system
PASSWORD apm_system = eWqzd0asAmxZ0gcJpOvn

Changed password for user kibana_system
PASSWORD kibana_system = 1HLVxfqZMd7aFQS6Uabl

Changed password for user kibana
PASSWORD kibana = 1HLVxfqZMd7aFQS6Uabl

Changed password for user logstash_system
PASSWORD logstash_system = wUjY59H91WGvGaN8uFLc

Changed password for user beats_system
PASSWORD beats_system = 2p81hIdAzWKknhzA992m

Changed password for user remote_monitoring_user
PASSWORD remote_monitoring_user = 85HF85Fl6cPslJlA8wPG

Changed password for user elastic
PASSWORD elastic = 6kNbsxQGYZ2EQJiqJpgl
You will not be able to run the utility again, so make sure to record these passwords somewhere secure. You will need to use the kibana_system user’s password in the next section of this tutorial, and the elastic user’s password in the Configuring Filebeat step of this tutorial.
At this point in the tutorial you are finished configuring Elasticsearch. The next section explains how to configure Kibana’s network settings and its xpack security module.
Step 3 — Configuring Kibana
In the previous section of this tutorial, you configured Elasticsearch to listen for connections on your Elasticsearch server’s private IP address. You will need to do the same for Kibana so that Filebeats on your Suricata server can reach it.
First you’ll enable Kibana’s xpack security functionality by generating some secrets that Kibana will use to store data in Elasticsearch. Then you’ll configure Kibana’s network setting and authentication details to connect to Elasticsearch.
Enabling xpack.security in Kibana
To get started with xpack security settings in Kibana, you need to generate some encryption keys. Kibana uses these keys to store session data (like cookies), as well as various saved dashboards and views of data in Elasticsearch.
You can generate the required encryption keys using the kibana-encryption-keys utility that is included in the /usr/share/kibana/bin directory. Run the following to cd to the directory and then generate the keys:
- cd /usr/share/kibana/bin/
- sudo ./kibana-encryption-keys generate -q
The -q flag suppresses the tool’s instructions so that you only receive output like the following:
Outputxpack.encryptedSavedObjects.encryptionKey: 66fbd85ceb3cba51c0e939fb2526f585
xpack.reporting.encryptionKey: 9358f4bc7189ae0ade1b8deeec7f38ef
xpack.security.encryptionKey: 8f847a594e4a813c4187fa93c884e92b
Copy your output somewhere secure. You will now add them to Kibana’s /etc/kibana/kibana.yml configuration file.
Open the file using nano or your preferred editor:
- sudo nano /etc/kibana/kibana.yml
Go to the end of the file using the nano shortcut CTRL+v until you reach the end. Paste the three xpack lines that you copied to the end of the file:
. . .

# Specifies locale to be used for all localizable strings, dates and number formats.
# Supported languages are the following: English - en , by default , Chinese - zh-CN .
#i18n.locale: "en"

xpack.encryptedSavedObjects.encryptionKey: 66fbd85ceb3cba51c0e939fb2526f585
xpack.reporting.encryptionKey: 9358f4bc7189ae0ade1b8deeec7f38ef
xpack.security.encryptionKey: 8f847a594e4a813c4187fa93c884e92b
Keep the file open and proceed to the next section where you will configure Kibana’s network settings.
Configuring Kibana Networking
To configure Kibana’s networking so that it is available on your Elasticsearch server’s private IP address, find the commented out #server.host: "localhost" line in /etc/kibana/kibana.yml. The line is near the beginning of the file. Add a new line after it with your server’s private IP address, as highlighted below:
# Kibana is served by a back end server. This setting specifies the port to use.
#server.port: 5601

# Specifies the address to which the Kibana server will bind. IP addresses and host names are both valid values.
# The default is 'localhost', which usually means remote machines will not be able to connect.
# To allow connections from remote users, set this parameter to a non-loopback address.
#server.host: "localhost"
server.host: "your_private_ip"
Substitute your private IP in place of the your_private_ip address.
Save and close the file when you are done editing it. If you are using nano, you can do so with CTRL+X, then Y and ENTER to confirm.
Next, you’ll need to configure the username and password that Kibana uses to connect to Elasticsearch.
Configuring Kibana Credentials
There are two ways to set the username and password that Kibana uses to authenticate to Elasticsearch. The first is to edit the /etc/kibana/kibana.yml configuration file and add the values there. The second method is to store the values in Kibana’s keystore, which is an obfuscated file that Kibana can use to store secrets.
We’ll use the keystore method in this tutorial since it avoids editing Kibana’s configuration file directly
If you prefer to edit the file instead, the settings to configure in it are elasticsearch.username and elasticsearch.password.
If you choose to edit the configuration file, skip the rest of the steps in this section.
To add a secret to the keystore using the kibana-keystore utility, first cd to the /usr/share/kibana/bin directory. Next, run the following command to set the username for Kibana:
- sudo ./kibana-keystore add elasticsearch.username
You will receive a prompt like the following:
Enter value for elasticsearch.username: *************
Enter kibana_system when prompted, either by copying and pasting, or typing the username carefully. Each character that you type will be masked with an * asterisk character. Press ENTER or RETURN when you are done entering the username.
Now repeat the same command for the password. Be sure to copy the password for the kibana_system user that you generated in the previous section of this tutorial. For reference, in this tutorial the example password is 1HLVxfqZMd7aFQS6Uabl.
Run the following command to set the password:
- sudo ./kibana-keystore add elasticsearch.password
When prompted, paste the password to avoid any transcription errors:
Enter value for elasticsearch.password: ********************
Starting Kibana
Now that you have configured networking and the xpack security settings for Kibana, as well as added credentials to the keystore, you need to start it for the changes to take effect.
Run the following systemctl command to restart Kibana:
- sudo systemctl start kibana.service
Once Kibana starts, you can continue to the next section of this tutorial where you will configure Filebeat on your Suricata server to send its logs to Elasticsearch.
Step 4 — Installing Filebeat
Now that your Elasticsearch and Kibana processes are configured with the correct network and authentication settings, the next step is to install and set up Filebeat on your Suricata server.
To get started installing Filebeat, add the Elastic GPG key to your Suricata server with the following command:
- curl -fsSL https://artifacts.elastic.co/GPG-KEY-elasticsearch | sudo apt-key add -
Next, add the Elastic source list to the sources.list.d directory, where apt will search for new sources:
- echo "deb https://artifacts.elastic.co/packages/7.x/apt stable main" | sudo tee -a /etc/apt/sources.list.d/elastic-7.x.list
Now update the server’s package index and install the Filebeat package:
- sudo apt update
- sudo apt install filebeat
Next you’ll need to configure Filebeat to connect to both Elasticsearch and Kibana. Open the /etc/filebeat/filebeat.yml configuration file using nano or your preferred editor:
- sudo nano /etc/filebeat/filebeat.yml
Find the Kibana section of the file around line 100. Add a line after the commented out #host: "localhost:5601" line that points to your Kibana instance’s private IP address and port:
. . .
# Starting with Beats version 6.0.0, the dashboards are loaded via the Kibana API.
# This requires a Kibana endpoint configuration.
setup.kibana:

  # Kibana Host
  # Scheme and port can be left out and will be set to the default (http and 5601)
  # In case you specify and additional path, the scheme is required: http://localhost:5601/path
  # IPv6 addresses should always be defined as: https://[2001:db8::1]:5601
  #host: "localhost:5601"
  host: "your_private_ip:5601"

. . .
This change will ensure that Filebeat can connect to Kibana in order to create the various SIEM indices, dashboards, and processing pipelines in Elasticsearch to handle your Suricata logs.
Next, find the Elasticsearch Output section of the file around line 130 and edit the hosts, username, and password settings to match the values for your Elasticsearch server:
output.elasticsearch:
  # Array of hosts to connect to.
  hosts: ["your_private_ip:9200"]

  # Protocol - either `http` (default) or `https`.
  #protocol: "https"

  # Authentication credentials - either API key or username/password.
  #api_key: "id:api_key"
  username: "elastic"
  password: "6kNbsxQGYZ2EQJiqJpgl"

. . .
Substitute in your Elasticsearch server’s private IP address on the hosts line in place of the your_private_ip value. Uncomment the username field and leave it set to the elastic user. Change the password field from changeme to the password for the elastic user that you generated in the Configuring Elasticsearch Passwords section of this tutorial.
Save and close the file when you are done editing it. If you are using nano, you can do so with CTRL+X, then Y and ENTER to confirm.
Next, enable Filebeats’ built-in Suricata module with the following command:
- sudo filebeat modules enable suricata
Now that Filebeat is configured to connect to Elasticsearch and Kibana, with the Suricata module enabled, the next step is to load the SIEM dashboards and pipelines into Elasticsearch.
Run the filebeat setup command. It may take a few minutes to load everything:
- sudo filebeat setup
Once the command finishes you should receive output like the following:
OutputOverwriting ILM policy is disabled. Set `setup.ilm.overwrite: true` for enabling.

Index setup finished.
Loading dashboards (Kibana must be running and reachable)
Loaded dashboards
Setting up ML using setup --machine-learning is going to be removed in 8.0.0. Please use the ML app instead.
See more: https://www.elastic.co/guide/en/machine-learning/current/index.html
It is not possible to load ML jobs into an Elasticsearch 8.0.0 or newer using the Beat.
Loaded machine learning job configurations
Loaded Ingest pipelines
If there are no errors, use the systemctl command to start Filebeat. It will begin sending events from Suricata’s eve.json log to Elasticsearch once it is running.
- sudo systemctl start filebeat.service
Now that you have Filebeat, Kibana, and Elasticsearch configured to process your Suricata logs, the last step in this tutorial is to connect to Kibana and explore the SIEM dashboards.
Step 5 — Navigating Kibana’s SIEM Dashboards
Kibana is the graphical component of the Elastic stack. You will use Kibana with your browser to explore Suricata’s event and alert data. Since you configured Kibana to only be available via your Elasticsearch server’s private IP address, you will need to use an SSH tunnel to connect to Kibana.
Connecting to Kibana with SSH
SSH has an option -L that lets you forward network traffic on a local port over its connection to a remote IP address and port on a server. You will use this option to forward traffic from your browser to your Kibana instance.
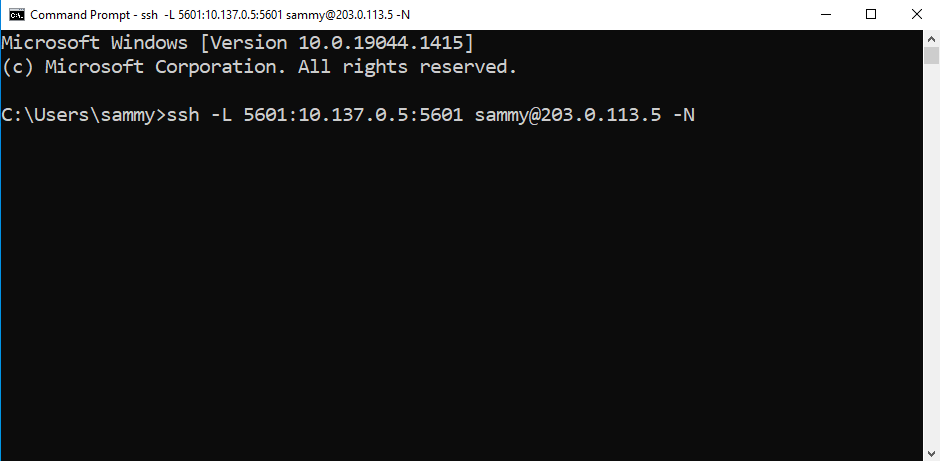
On Linux, macOS, and updated versions of Windows 10 and higher, you can use the built-in SSH client to create the tunnel. You will use this command each time you want to connect to Kibana. You can close this connection at any time and then run the SSH command again to re-establish the tunnel.
Run the following command in a terminal on your local desktop or laptop computer to create the SSH tunnel to Kibana:
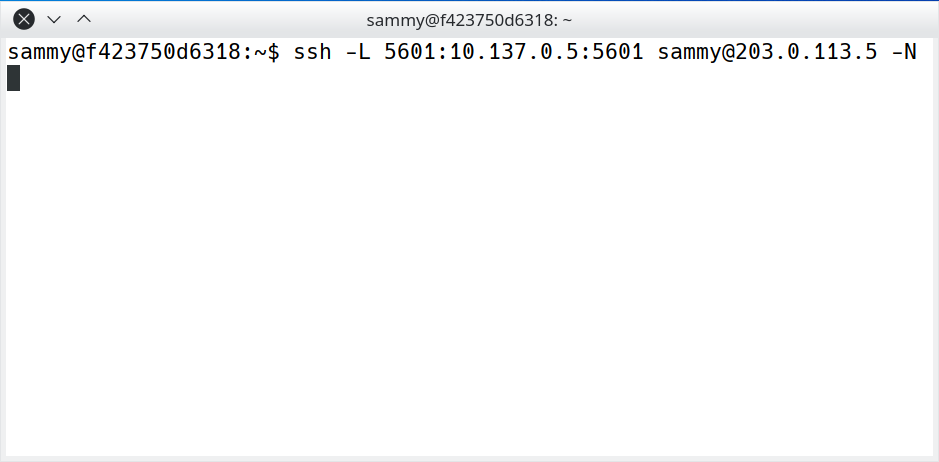
- ssh -L 5601:your_private_ip:5601 sammy@203.0.113.5 -N
The various arguments to SSH are:
- The
-Lflag forwards traffic to your local system on port5601to the remote server. - The
your_private_ip:5601portion of the command specifies the service on your Elasticsearch server where your traffic will be fowarded to. In this case that service is Kibana. Be sure to substitute your Elasticsearch server’s private IP address in place ofyour_private_ip - The
203.11.0.5address is the public IP address that you use to connect to and administer your server. Substitute your Elasticsearch server’s public IP address in its place. - The
-Nflag instructs SSH to not run a command like an interactive/bin/bashshell, and instead just hold the connection open. It is generally used when forwarding ports like in this example.
If you would like to close the tunnel at any time, press CTRL+C.
On Windows your terminal should resemble the following screenshot:
Note: You may be prompted to enter a password if you are not using an SSH key. Type or paste it into the prompt and press ENTER or RETURN.
On macOS and Linux your terminal will be similar to the following screenshot:
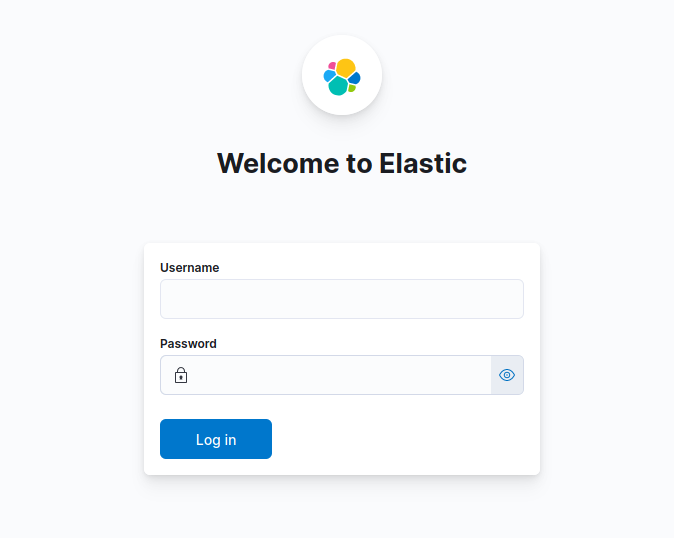
Once you have connected to your Elasticsearch server over SSH with the port forward in place, open your browser and visit http://127.0.0.1:5601. You will be redirected to Kibana’s login page:
If your browser cannot connect to Kibana you will receive a message like the following in your terminal:
Outputchannel 3: open failed: connect failed: No route to host
This error indicates that your SSH tunnel is unable to reach the Kibana service on your server. Ensure that you have specified the correct private IP address for your Elasticsearch server and reload the page in your browser.
Log in to your Kibana server using elastic for the Username, and the password that you copied earlier in this tutorial for the user.
Browsing Kibana SIEM Dashboards
Once you are logged into Kibana you can explore the Suricata dashboards that Filebeat configured for you.
In the search field at the top of the Kibana Welcome page, input the search terms type:dashboard suricata. This search will return two results: the Suricata Events and Suricata Alerts dashboards per the following screenshot:
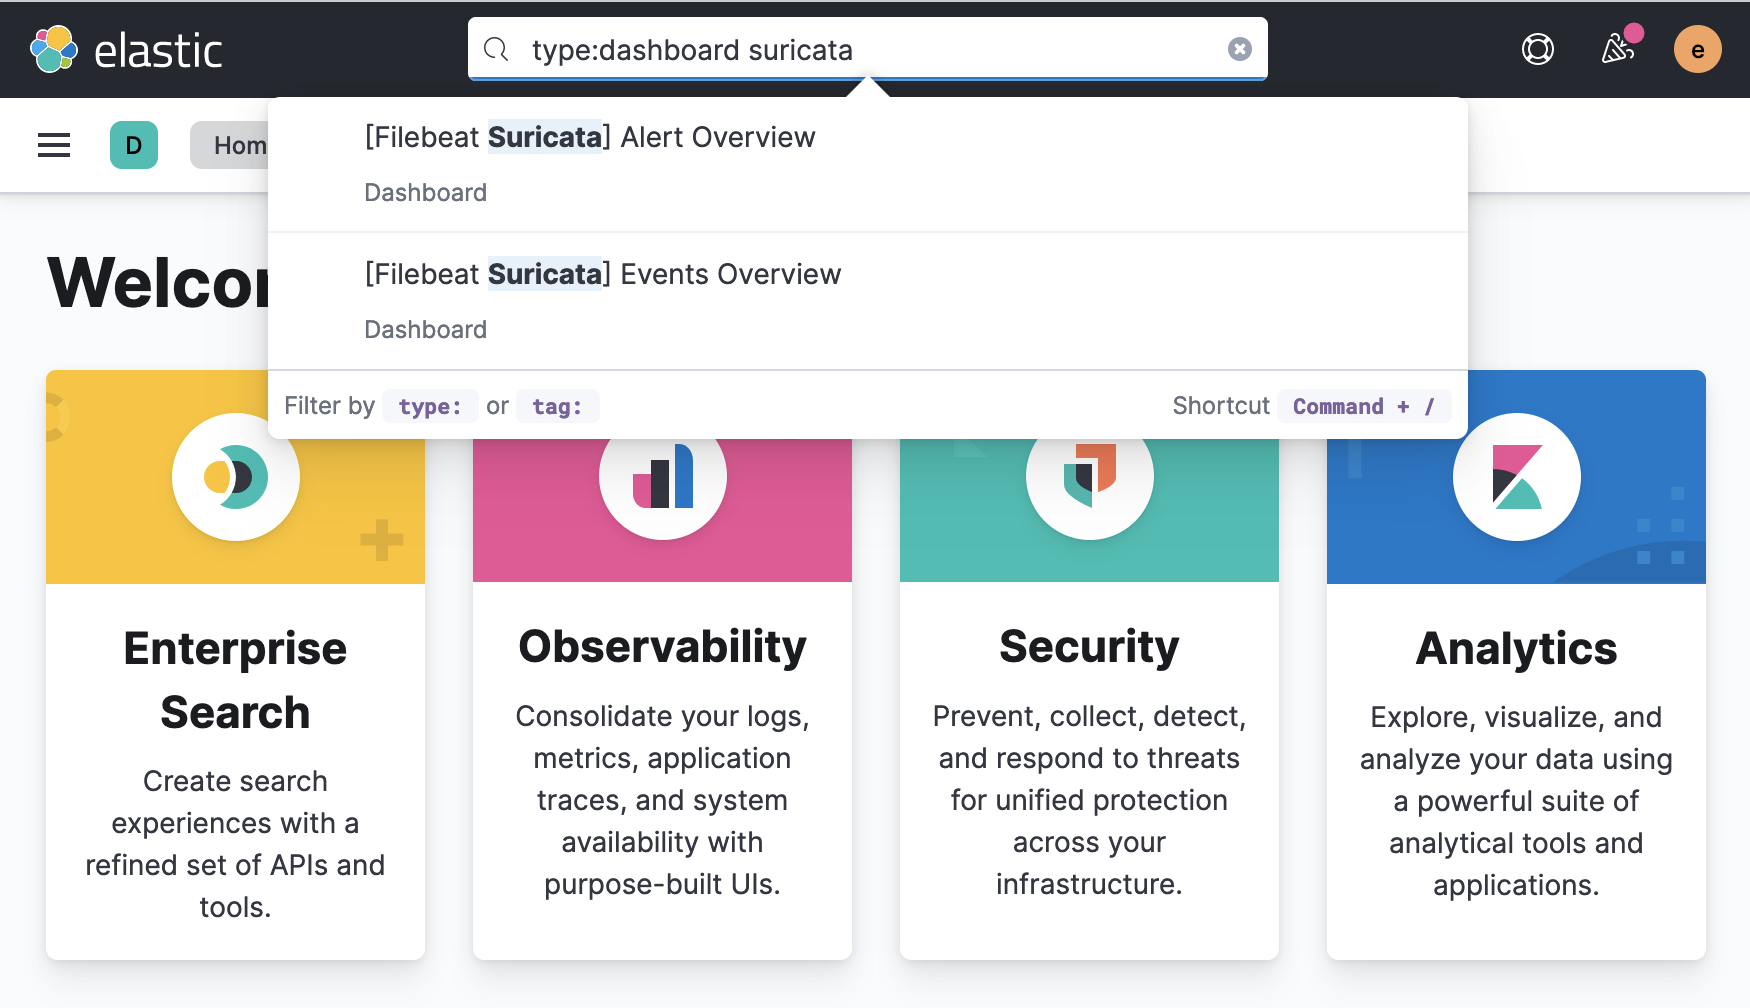
Click the [Filebeat Suricata] Events Overview result to visit the Kibana dashboard that shows an overview of all logged Suricata events:
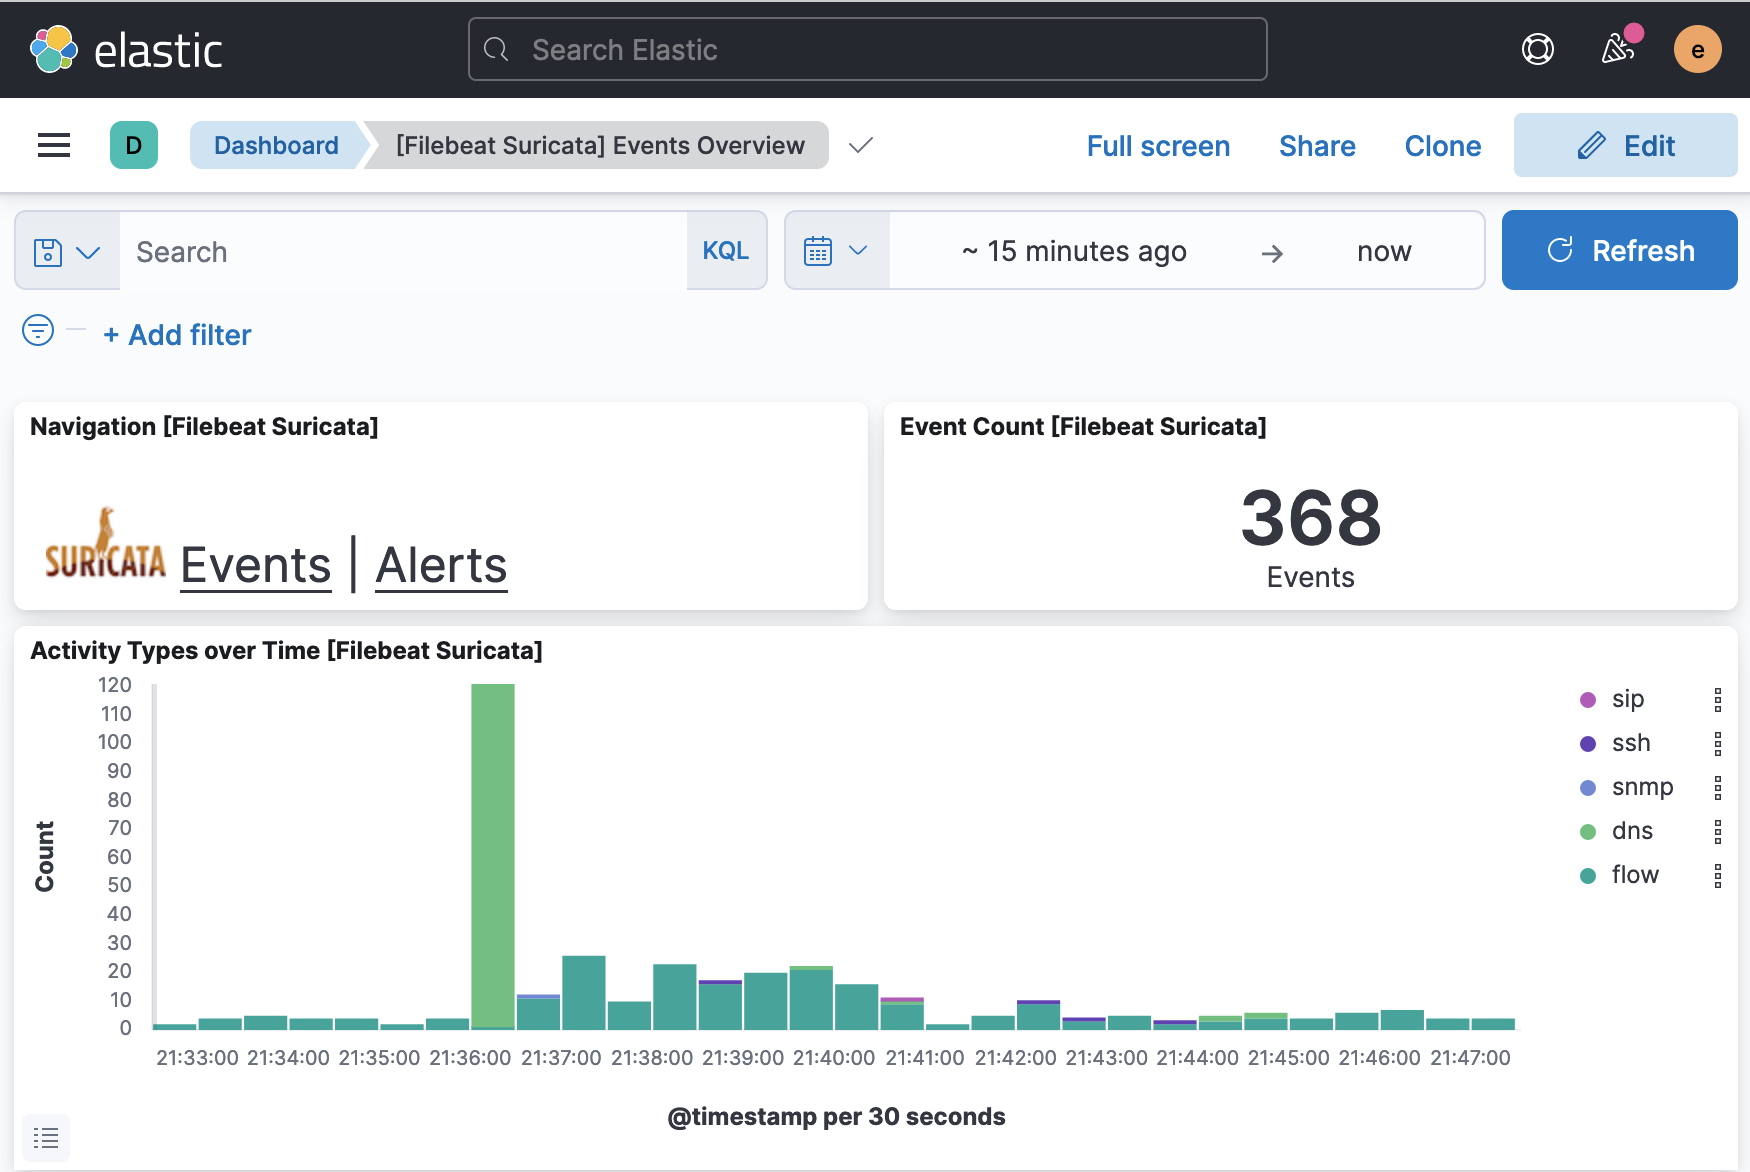
To visit the Suricata Alerts dashboard, repeat the search or click the Alerts link that is included in the Events dashboard. Your page should resemble the following screenshot:
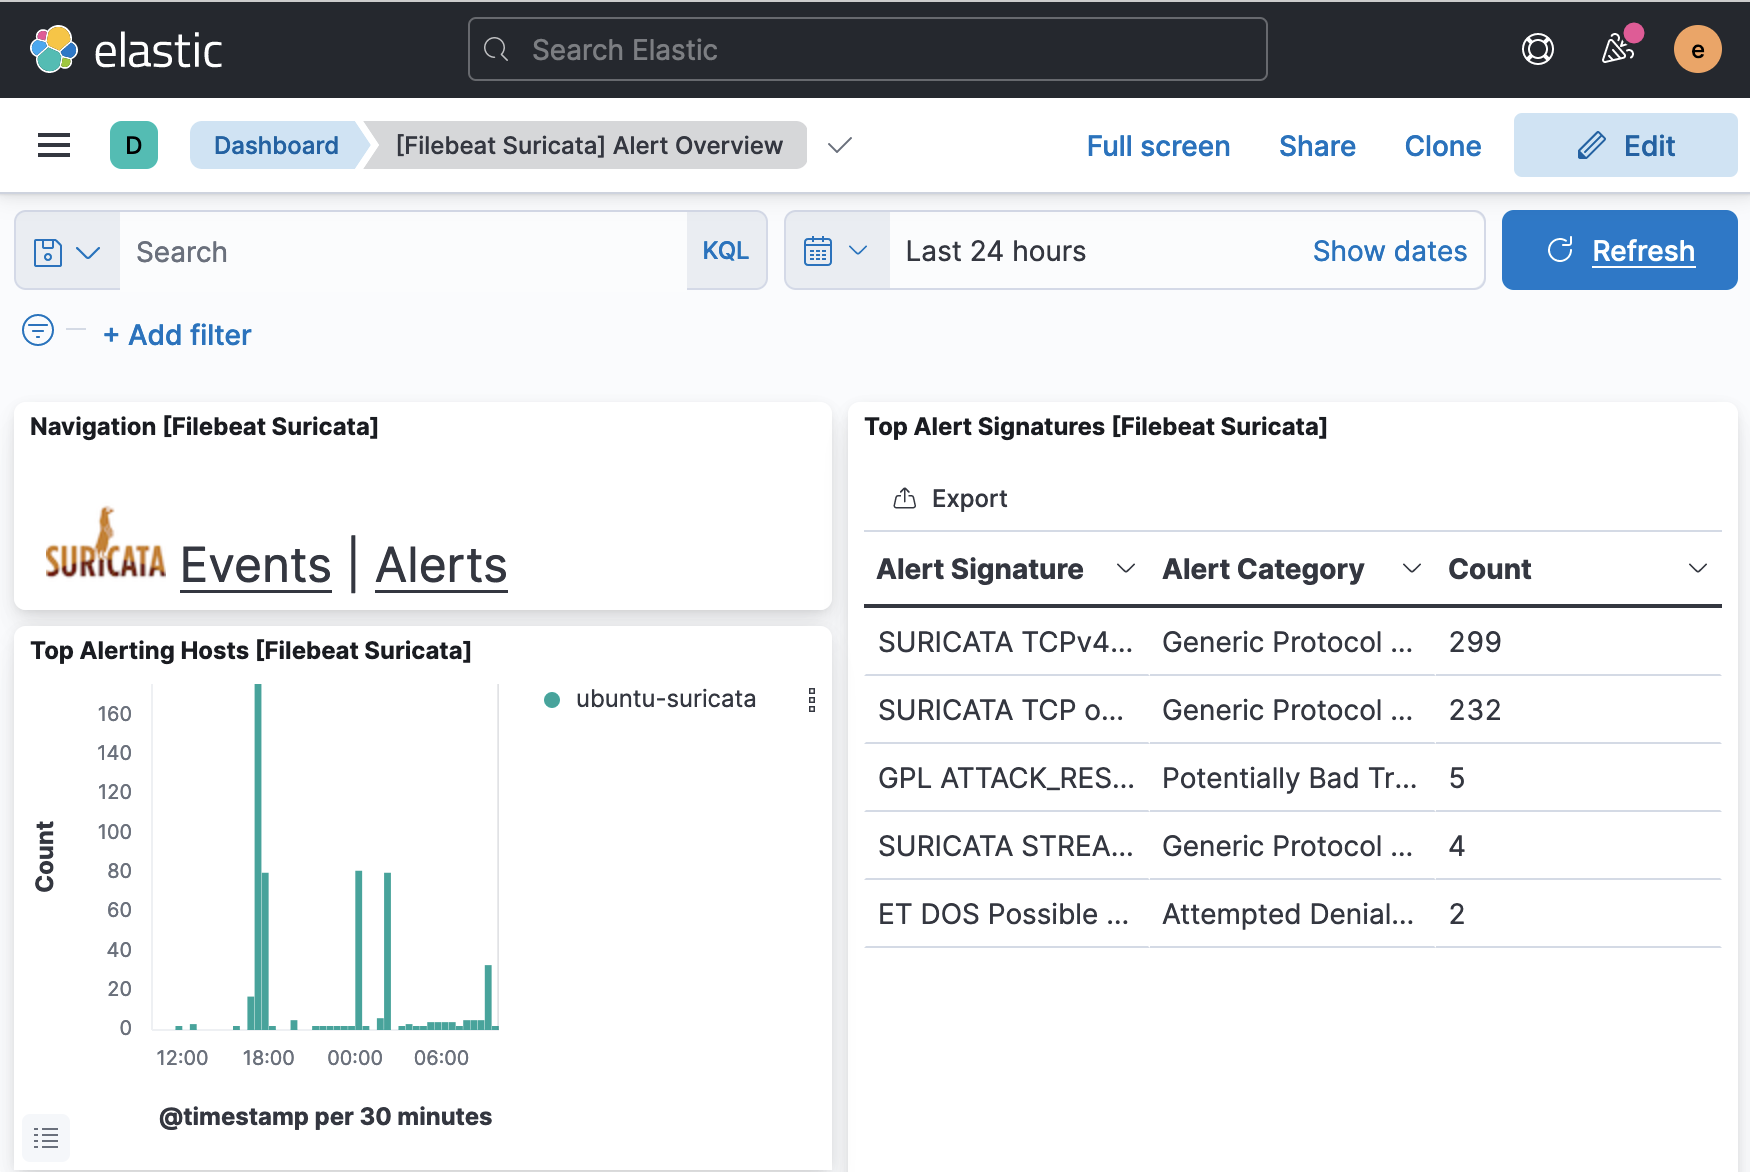
If you would like to inspect the events and alerts that each dashboard displays, scroll to the bottom of the page where you will find a table that lists each event and alert. You can expand each entry to view the original log entry from Suricata, and examine in detail the various fields like source and destination IPs for an alert, the attack type, Suricata signature ID, and others.
Kibana also has a built-in set of Security dashboards that you can access using the menu on the left side of the browser window. Navigate to the Network dashboard for an overview of events displayed on a map, as well as aggregate data about events on your network. Your dashboard should resemble the following screenshot:
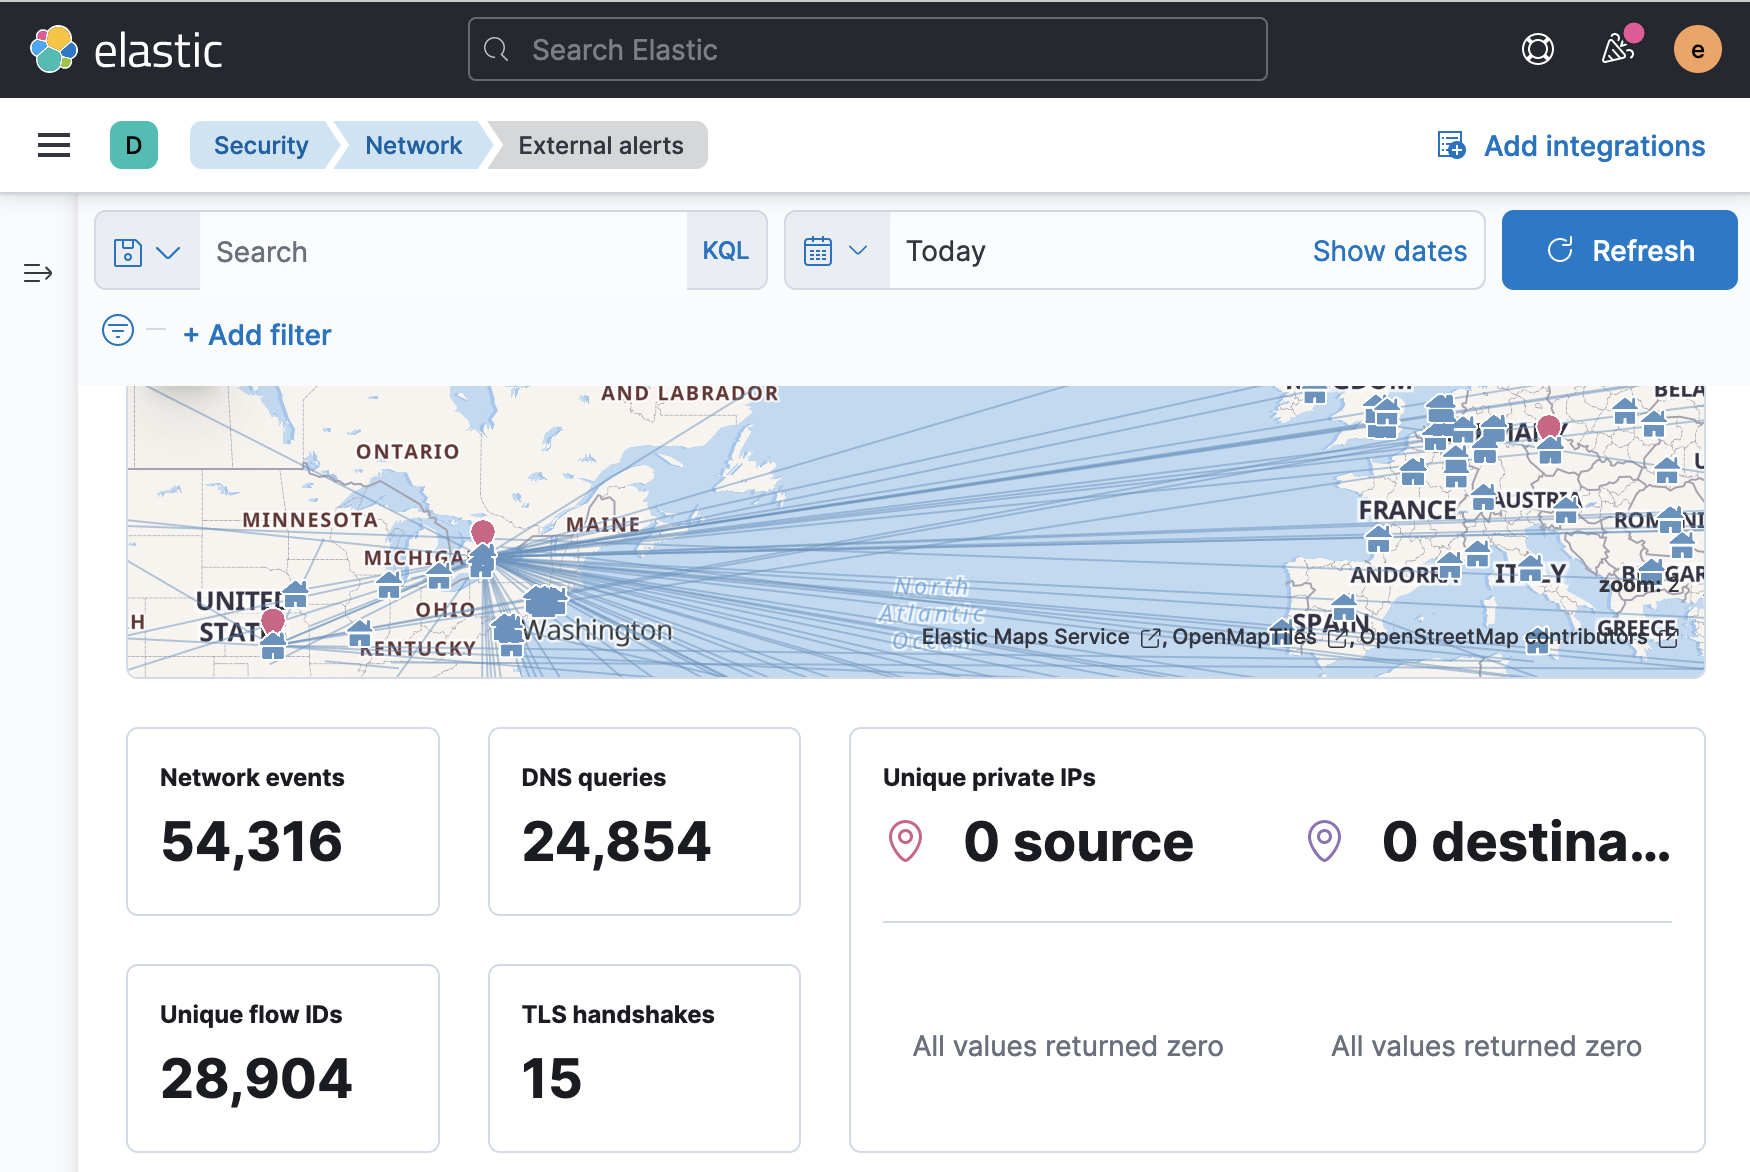
You can scroll to the bottom of the Network dashboard for a table that lists all of the events that match your specified search timeframe. You can also examine each event in detail, or select an event to generate a Kibana timeline, that you can then use to investigate specific traffic flows, alerts, or community IDs.
Conclusion
In this tutorial you installed and configured Elasticsearch and Kibana on a standalone server. You configured both tools to be available on a private IP address. You also configured Elasticsearch and Kibana’s authentication settings using the xpack security module that is included with each tool.
After completing the Elasticsearch and Kibana configuration steps, you also installed and configured Filebeat on your Suricata server. You used Filebeat to populate Kibana’s dashboards and start sending Suricata logs to Elasticsearch.
Finally, you created an SSH tunnel to your Elasticsearch server and logged into Kibana. You located the new Suricata Events and Alerts dashboards, as well as the Network dashboard.
The last tutorial in this series will guide you through using Kibana’s SIEM functionality to process your Suricata alerts. In it you will explore how to create cases to track specific alerts, timelines to correlate network flows, and rules to match specific Suricata events that you would like to track or analyze in more detail.
Thanks for learning with the DigitalOcean Community. Check out our offerings for compute, storage, networking, and managed databases.
Tutorial Series: Securing Your Network with Suricata
Suricata is a flexible, high performance Network Security Monitoring (NSM) tool that can detect and block attacks against your network.
This series will explore how to install Suricata on various operating systems, how to understand and write your own signatures to detect malicious or unknown traffic, and how to configure Suricata in both Intrusion Detection (IDS) and Intrusion Prevention (IPS) modes.
Once you have Suricata configured and running on your network, you’ll learn how to build your own Security Information and Event Management (SIEM) tool on top of the data that Suricata collects.
This textbox defaults to using Markdown to format your answer.
You can type !ref in this text area to quickly search our full set of tutorials, documentation & marketplace offerings and insert the link!


